EVIDENCE OF CLIMATE CHANGE – OCEAN HEAT CONTENT CHANGES
Earth-orbiting satellites and other technological advances have enabled scientists to see the big picture, collecting many different types of information about our planet and its climate on a global scale. This body of data, collected over many years, reveals the signals of a changing climate.
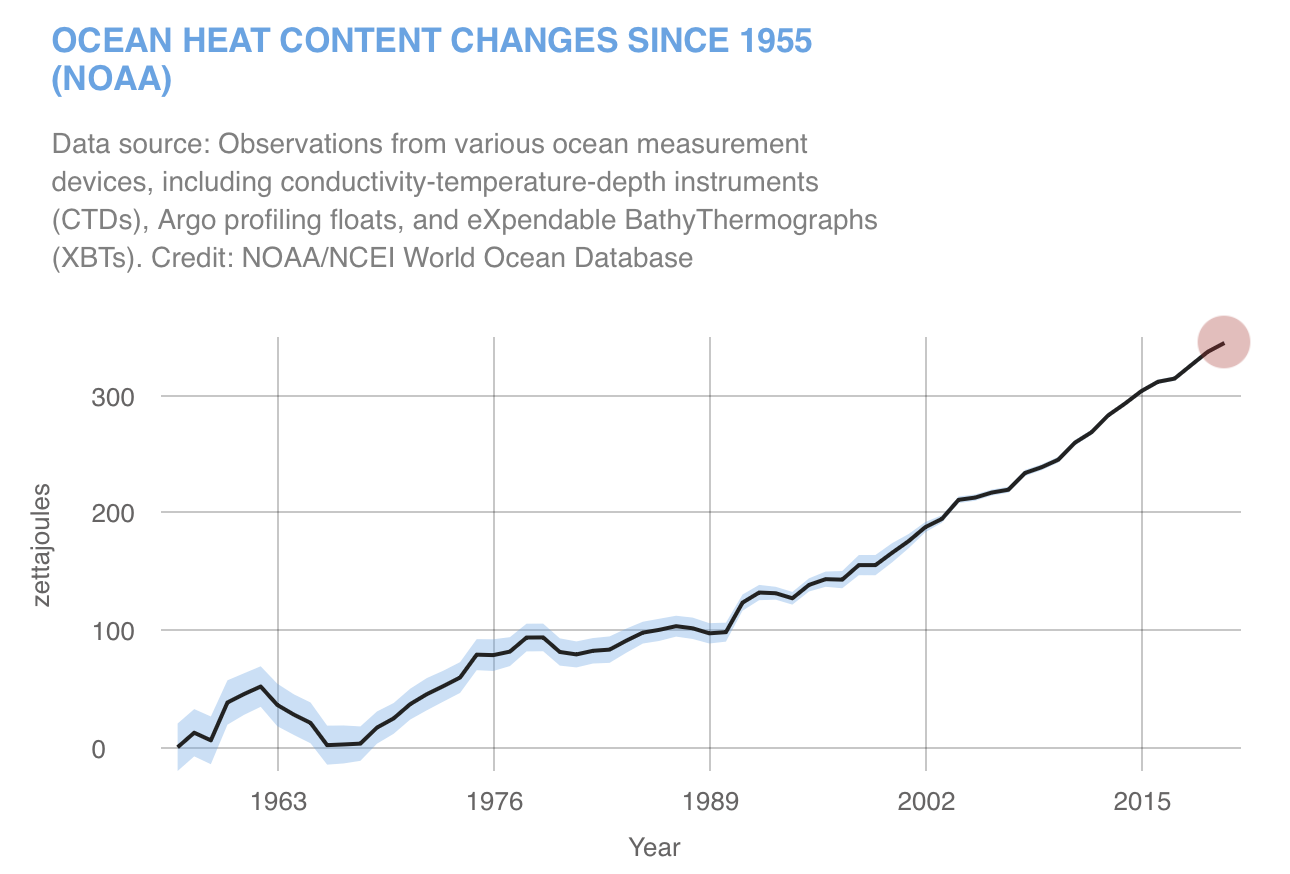
Ninety percent of global warming is occurring in the ocean, causing the water’s internal heat to increase since modern record keeping began in 1955, as shown in the upper chart. This chart shows annual estimates for the first 2,000 meters of ocean depth.
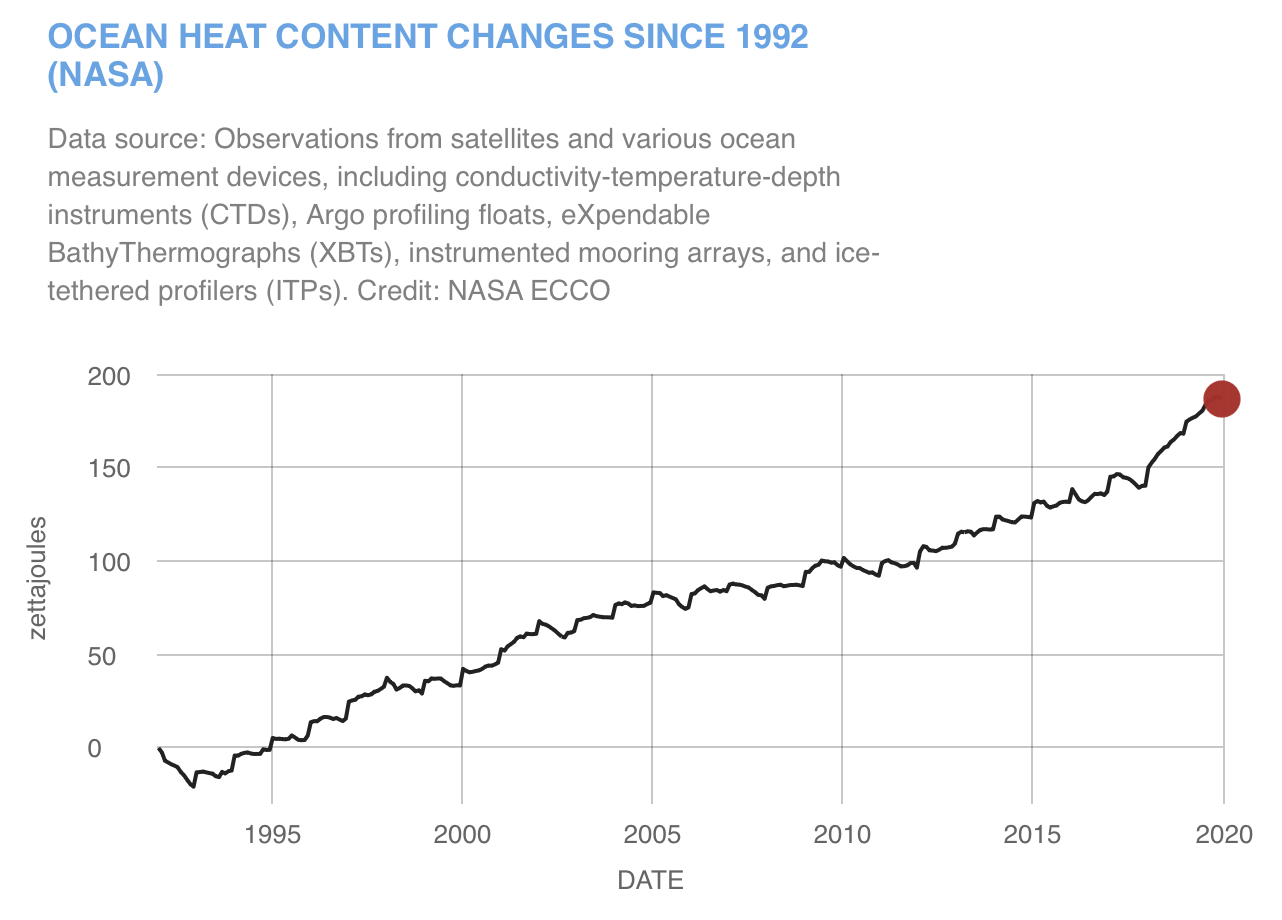
Each data point in the upper chart represents a five-year average. For example, the 2020 value represents the average change in ocean heat content since 1955.The lower charttracks monthly changes in ocean heat content for the entire water column (from the top to the bottom of the ocean) from 1992 to current year, integrating observations from satellites, in-water instruments, and computer models. Both charts are expressed in zettajoules.
Heat stored in the ocean causes its water to expand, which is responsible for one-third to one-half of global sea level rise. Most of the added energy is stored at the surface, at a depth of zero to 700 meters. The last 10 years were the ocean’s warmest decade since at least the 1800s. The year 2022 was the ocean’s warmest recorded year and saw the highest global sea level.
